This guide explains how to monitor and investigate high Diameter response times in the PCC system. Follow the steps below to ensure any anomalies are detected and reported promptly.
Prerequisites
- Access to the dpcc pod.
- Permissions to execute commands in the pod.
Steps to Check High Response Times
-
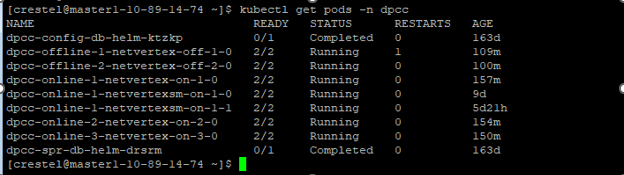
Login to the
dpccpod:
Run the following command to list available pods:
kubectl get pods -n dpcc
-
Access the required pod:
Use the command below to log in to the appropriatedpccpod:
kubectl exec -it -n dpcc dpcc-offline-1-netvertex-off-1-0 -c dpcc-offline-1-netvertex-off-1 sh -
Navigate to the logs directory:
Once inside the pod, navigate to the directory containing alert logs:
cd /opt/server/logs/alertlog -
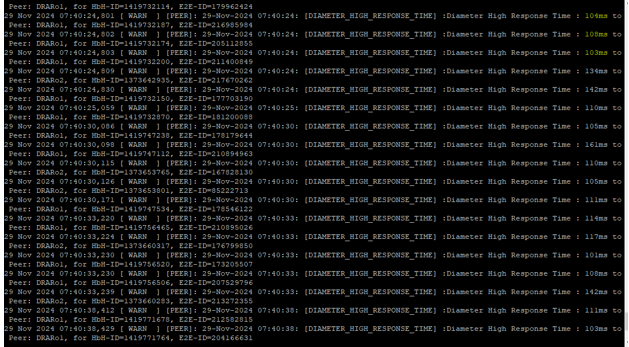
Monitor Diameter Response Times:
Execute the following command to filter for high response time alerts in real-time:
tail -f elite-netvertex-alert.log | grep 'DIAMETER_HIGH_RESPONSE_TIME'
-
Analyze the response time:
- Observe if the response times gradually increase.
- Critical thresholds to watch for Continuous increase from 200ms to 2000ms.
-
Escalate if necessary:
- If high response times persist, please raise a ticket with support
Priyanka Bhotika
Comments